
The chart below shows two sets of statistics. The first line (in blue) is simply the total percentage of nominees that I was correctly predicting at a given point in the year, with each nominee in all 24 categories being given equal rate. (Yes, even those hard to predict categories.) The second line (in red) is my “Close Score”, where I give myself partial credit for my alternate choices, proportionate to their ranking at the time.
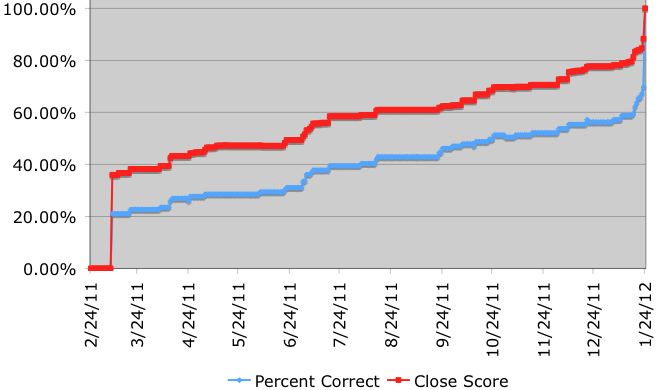
Why would I do this? Surely the whole point is to predict the “right” answer as early as possible, which is what the first line tells me. But the simple percentage also leaves out a lot of information. Did I get the wrong answer because I was clueless and had never heard of the film in question, or did I get the answer wrong because there were 6 contenders in a field of 5, and the Academy happened to snub the one I predicted?
This is all the more important for someone like me who tries to predict the nominees and winners months and years in advance. At the end of the game I do indeed have to reckon with right and wrong, but how do I get better if I don’t have some way of tracking the subtleties? After all, if the eventual nominees are all in my top ten a year or six months out, that’s better than if they were at the bottom of a list of fifty.
So how did I calculate the Close Scores? Let’s take the director’s race as an example: If I correctly predicted a director to be a nominee, regardless of whether I ranked them number one or number 5, then I gave myself full credit (100%). For all the others I calculated their score by dividing the number of nominees by their ranking at the time. So if I had a director ranked sixth in my predictions, their Close Score would be ⅚ or 83%. But if they ranked 50th in my predictions, their Close Score would be 5/50 (10%). If a director wasn’t in my listings at all, then they got zero points. The system is designed to reward those at the top of the list (those that are closest), with a steep decline to assure some level of rigor. The difference between being sixth on my list and tenth, for example, drastically reduces their score from 83% (5/6) to 50% (5/10).
It’s not a perfect system, but combined with the statistics on the actual percentage of correct answers, I hope it will give some sense of how I’m doing--particularly once I have enough years under my belt to begin comparing my instincts for early predictions. For now, it looks like the times when I had the greatest increase in both my percentages and my close scores was immediately after Cannes, and then again beginning in September as the early Oscar contenders started to either shine or fade away.
For even more information on how I am doing in each race, and eventually an analysis of each individual race, be sure to check out my Track Record Page.
See predictions for all categories at the 84th Oscars HERE.
Switch to another year: 84th, 85th, 86th, 87th, 88th, 89th
No comments:
Post a Comment